Coronavirus: Just the Numbers [Unassailably Objective] - Politics Forum.org | PoFo

Wandering the information superhighway, he came upon the last refuge of civilization, PoFo, the only forum on the internet ...

Political issues and parties in the USA and Canada.

Moderator: PoFo North America Mods

Forum rules: No one line posts please.
#15108148
https://covid19.who.int/region/amro/country/us

Trump and the WHO do not get along but according to the WHO, there is no evidence of a second wave forming.

If I cherry pick from July 6th onward, average daily deaths are roughly 599 a day, rounded up.
To put this in perspective, an average of 7,708 people died in the US each day in 2017: https://www.cdc.gov/nchs/fastats/deaths.htm

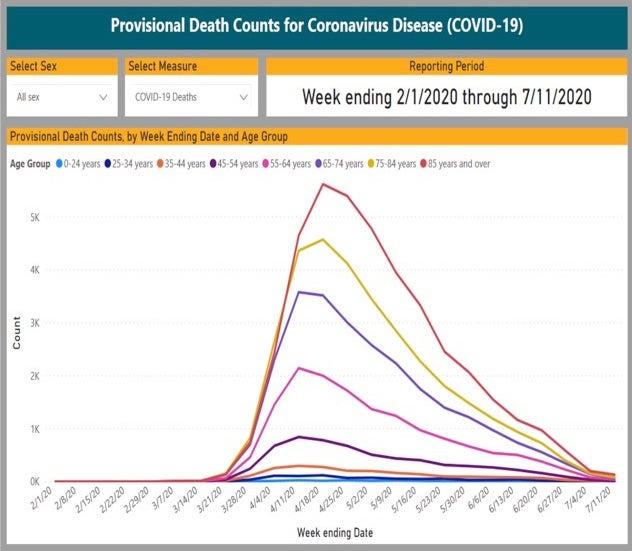
Looking at the graph, the rise in case numbers started in mid to late June. We are already more than two weeks beyond that point and there has been no rise in deaths, instead they have continued to fall. Therefore, there is no evidence thus far of a second wave.

As I wrote in another thread, I expect conspiracies about the death numbers being suppressed to start appearing as that will be the only way they might keep this going until the election, yet similar data in the rest of the world will make that hard to argue for.
#15108151
Yes and we need to watch out for the next trick from these Liberal fraudsters: long term illness. Note how they post figures to scare the gullible. Take for example hospitalisations. What percentage of hospitalised people from other conditions feel their state of health is fully back to where it was before the condition,say 4 or 8 weeks after leaving hospital?
#15108168
Rich wrote:Yes and we need to watch out for the next trick from these Liberal fraudsters: long term illness. Note how they post figures to scare the gullible. Take for example hospitalisations. What percentage of hospitalised people from other conditions feel their state of health is fully back to where it was before the condition,say 4 or 8 weeks after leaving hospital?

Yeah, a coronavirus is a common type of flu virus, this one having been significantly worse, but this is the first time in my life that I've heard talk of people supposedly needing lung transplants or developing brain damage years down the road after they've been sick. I'm the kind of guy who absorbs information like a sponge and can spit it out later and you know, obviously people would need to take my word for it but I'm pretty sure I have never heard such a thing about these kinds of diseases before now in my entire life. You either develop problems immediately or you're fine, is how it always was presented to me before.
#15108888
https://www.cdc.gov/nchs/nvss/vsrr/covid19/index.htm

Projected coronavirus deaths have fallen for the 13th week in a row.

Lots of medical companies speaking to congress this week about possible vaccines. One of the most promising ones appears to be Astrazeneca-Oxford (the university in the UK). They claim that they may have a vaccine available by September, which would probably kill interest in a second/third wave next fall.
#15108896
Wulfschilde wrote:Yeah, a coronavirus is a common type of flu virus, this one having been significantly worse, but this is the first time in my life that I've heard talk of people supposedly needing lung transplants or developing brain damage years down the road after they've been sick. I'm the kind of guy who absorbs information like a sponge and can spit it out later and you know, obviously people would need to take my word for it but I'm pretty sure I have never heard such a thing about these kinds of diseases before now in my entire life. You either develop problems immediately or you're fine, is how it always was presented to me before.

Maybe that is because Dr. Fauci wasn't making stuff up about the common flu virus as he went along to impress the news media.
#15108900
Wulfschilde wrote:https://www.cdc.gov/nchs/nvss/vsrr/covid19/index.htm

Projected coronavirus deaths have fallen for the 13th week in a row.

Lots of medical companies speaking to congress this week about possible vaccines. One of the most promising ones appears to be Astrazeneca-Oxford (the university in the UK). They claim that they may have a vaccine available by September, which would probably kill interest in a second/third wave next fall.
Haven't we done this one before?

From the link
"Data during this period are incomplete because of the lag in time between when the death occurred and when the death certificate is completed, submitted to NCHS and processed for reporting purposes. This delay can range from 1 week to 8 weeks or more, depending on the jurisdiction and cause of death"

Which means there is always a fall over the last 8 weeks.
#15108904
BeesKnee5 wrote:Haven't we done this one before?

From the link
"Data during this period are incomplete because of the lag in time between when the death occurred and when the death certificate is completed, submitted to NCHS and processed for reporting purposes. This delay can range from 1 week to 8 weeks or more, depending on the jurisdiction and cause of death"

Which means there is always a fall over the last 8 weeks.

The point that can be seen by the graph posted by blackjack21 is that the deaths in July have fallen from the highs of April to the lows of March.
#15108905
Hindsite wrote:The point that can be seen by the graph posted by blackjack21 is that the deaths in July have fallen from the highs of April to the lows of March.


No, this is provisional data based on information received upto 11th July. It's provisional because there is a reporting lag of upto 8 weeks, which is why the final week reports almost no deaths.

Therefore it tells you very little about what the final deaths will be since the end of may.
#15108907
BeesKnee5 wrote:No, this is provisional data based on information received upto 11th July. It's provisional because there is a reporting lag of upto 8 weeks, which is why the final week reports almost no deaths.

Therefore it tells you very little about what the final deaths will be since the end of may.

It was updated on July 20, 2020 and is still just as low. So the trend continues to indicate a much lower death rate than the high in April. Certainly there appears to be no way that it will again reach the high level of April. So regardless of what the left-wing fake news says, it is getting better, not worse. :lol:
#15108908
Hindsite wrote:It was updated on July 20, 2020 and is still just as low. So the trend continues to indicate a much lower death rate than the high in April. Certainly there appears to be no way that it will again reach the high level of April. So regardless of what the left-wing fake news says, it is getting better, not worse.


I bloody hope for your sake it doesn't reach the levels of April. Due to the lack of testing at the time it's hard to know how many cases caused that spike.


The seven day rolling average has risen from 515 to 802 since 5th July.

That does not suggest to me that it's getting better. The US is back at the same level of deaths it had on the 11th June.
#15108910
On the cases there is an estimation that can be done based on deaths and survival rates. The best estimates being 0.5-1% die and that the virus takes an average of 18 days to kill.

Applying that to the most deadly day in the US 2,748 on 21st April means an estimated 250,000 - 500,000 Americans contracted the virus on 3rd April. So only 1 in 10 infections were being tested and reported.

Use that against today's figures and you can see that about 33% of infections are being identified. To extrapolate this further means today's cases would need to be 85,000-170,000 if we are expecting to reach the death toll levels seen in April.

Taking this further, today's average cases of 68,000 could result in a daily death toll of between 1,000-2,000 in 18 days time.

Who thinks that the 7 day average US deaths on the 7th August will be less than today?
#15108933
BeesKnee5 wrote:Haven't we done this one before?

From the link
"Data during this period are incomplete because of the lag in time between when the death occurred and when the death certificate is completed, submitted to NCHS and processed for reporting purposes. This delay can range from 1 week to 8 weeks or more, depending on the jurisdiction and cause of death"

Which means there is always a fall over the last 8 weeks.

Actually, the term "prospective deaths" that I used is meant to anticipate the ultimate total number of deaths for that time period. I reached the value by dividing the current number by the percentage of expected deaths that the current number represents, which gives you the expected total, although that total is not actually listed in their chart, they have only been off by a few percentage points each week according to them.
#15108936
Wulfschilde wrote:Actually, the term "prospective deaths" that I used is meant to anticipate the ultimate total number of deaths for that time period. I reached the value by dividing the current number by the percentage of expected deaths that the current number represents, which gives you the expected total, although that total is not actually listed in their chart, they have only been off by a few percentage points each week according to them.


So not only is your thread title incorrect but you have made two assumptions that cannot yet be justified.

First, that the final percentage will be 100 when compared to prior years.

Second that the proportion of covid deaths will be unchanged as the remaining deaths are added.

As per the footnote.

2Percent of expected deaths is the number of deaths for all causes for this week in 2020 compared to the average number across the same week in 2017–2019. Previous analyses of 2015–2016 provisional data completeness have found that completeness is lower in the first few weeks following the date of death (<25%), and then increases over time such that data are generally at least 75% complete within 8 weeks of when the death occurred (8).
#15108953
BeesKnee5 wrote:So not only is your thread title incorrect but you have made two assumptions that cannot yet be justified.

First, that the final percentage will be 100 when compared to prior years.

Second that the proportion of covid deaths will be unchanged as the remaining deaths are added.

As per the footnote.

2Percent of expected deaths is the number of deaths for all causes for this week in 2020 compared to the average number across the same week in 2017–2019. Previous analyses of 2015–2016 provisional data completeness have found that completeness is lower in the first few weeks following the date of death (<25%), and then increases over time such that data are generally at least 75% complete within 8 weeks of when the death occurred (8).

It's not a big assumption because as I mentioned, they've historically only been off by a few percentage points each week for months now. This means it would be safe to assume that they will continue to be within a few percentage points of their estimates. I've also used the word "prospective" according to its dictionary definition, so there should be no problems here. :)

But let's say that you are correct and the total number inches up a bit. What I've posted is that we are seeing a decline. If they all inch up an equal amount, which seems to be what you are suggesting, the decline I've noted would still exist because it's based upon their values relative to each other, not their total values.
#15108956
Wulfschilde wrote:It's not a big assumption because as I mentioned, they've historically only been off by a few percentage points each week for months now. This means it would be safe to assume that they will continue to be within a few percentage points of their estimates. I've also used the word "prospective" according to its dictionary definition, so there should be no problems here. :)


I've seen nothing to show they have been a few percentage points off. Mainly because they are not providing estimates.

They are reporting based on data received up to a given date.

For example :
Earlier today 14% of data was in for WE 18th July and covid deaths were 190.

Now 21% of data is in and the deaths are 336.

If the deaths end up at 100% of expected then thats an increase of 17%. If the CDC figures are varying so widely due to the paucity of data then on what grounds are you getting a few percent?

Wulfschilde wrote:But let's say that you are correct and the total number inches up a bit. What I've posted is that we are seeing a decline. If they all inch up an equal amount, which seems to be what you are suggesting, the decline I've noted would still exist because it's based upon their values relative to each other, not their total values.


Just simply no, they are not inching up an equal amount, the most recent figures are inching up significantly faster than the older figures because there is more data outstanding.

Look:
Here is what the totals looked like on the 4th July
https://web.archive.org/web/20200704200 ... /index.htm

Look at the figures
13th June 3185 deaths 85% of expected => 3747 @ 100% ( figure today 4000 @ 104% )
20th June 1640 deaths 65% of expected => 2523 @ 100% ( figure today 3496 @ 102% )
27th June 313 deaths 32% of expected => 978 @ 100% ( figure today 3171 @ 98% )

On this rate of change it is possible for 27th June to eventually exceed the 20th June and the same is true for all the weeks since, we will not know for certain for a few more weeks.

In fact the 4th July figure of 3082 with 89% of expected looks almost certain to be higher than the previous few weeks based on these figures and the 11th July is already over 20% higher than the 20th June with a similar amount of the data in.
#15108976
BeesKnee5 wrote:Look at the figures
13th June 3185 deaths 85% of expected => 3747 @ 100% ( figure today 4000 @ 104% )
20th June 1640 deaths 65% of expected => 2523 @ 100% ( figure today 3496 @ 102% )
27th June 313 deaths 32% of expected => 978 @ 100% ( figure today 3171 @ 98% )

On this rate of change it is possible for 27th June to eventually exceed the 20th June and the same is true for all the weeks since, we will not know for certain for a few more weeks.

In fact the 4th July figure of 3082 with 89% of expected looks almost certain to be higher than the previous few weeks based on these figures and the 11th July is already over 20% higher than the 20th June with a similar amount of the data in.

It's possible to break the streak if they are off by about 10% on the 27th but the 20th basically doesn't increase at all. That's not very likely but sure, if you want to insist, it's not impossible.

What's far more likely is that, if they are off, recent weeks will be off by similar amounts as to each other, in which case the trend will probably stay the same.
#15108979
Wulfschilde wrote:It's possible to break the streak if they are off by about 10% on the 27th but the 20th basically doesn't increase at all. That's not very likely but sure, if you want to insist, it's not impossible.

What's far more likely is that, if they are off, recent weeks will be off by similar amounts as to each other, in which case the trend will probably stay the same.


I agree the 27th is unlikely to overtake the 20th, my point was the evidence shows the gap is likely to narrow but we do not know by how much.

In reality all the data is pointing to the 4th July being the first rise as this would be consistent with the daily cases reported.
#15109089
BeesKnee5 wrote:I bloody hope for your sake it doesn't reach the levels of April. Due to the lack of testing at the time it's hard to know how many cases caused that spike.

The seven day rolling average has risen from 515 to 802 since 5th July.

That does not suggest to me that it's getting better. The US is back at the same level of deaths it had on the 11th June.

I don't see it.

BeesKnee5 wrote:Who thinks that the 7 day average US deaths on the 7th August will be less than today?

Me.
#15109096
Going back to the WHO figures in the OP, the 7 day moving average has increased from 492 for 1-7 July, to 751 for 15-21 July. So that basically tallies with BeesKnee5's figures (which I believe are the 7 day moving average from worldometers: https://www.worldometers.info/coronavirus/country/us/ ). The single day number at worldometers of 1,119 for 21 July was the highest since 2 June.
World War II Day by Day

April 18, Thursday The rise of a canny classroom[…]

He's a parasite

Most slow learners learn, they just do it slowly. […]

Seems like the Left in Western European countri[…]

a good point here, i am sure we all agree on thi[…]