late wrote: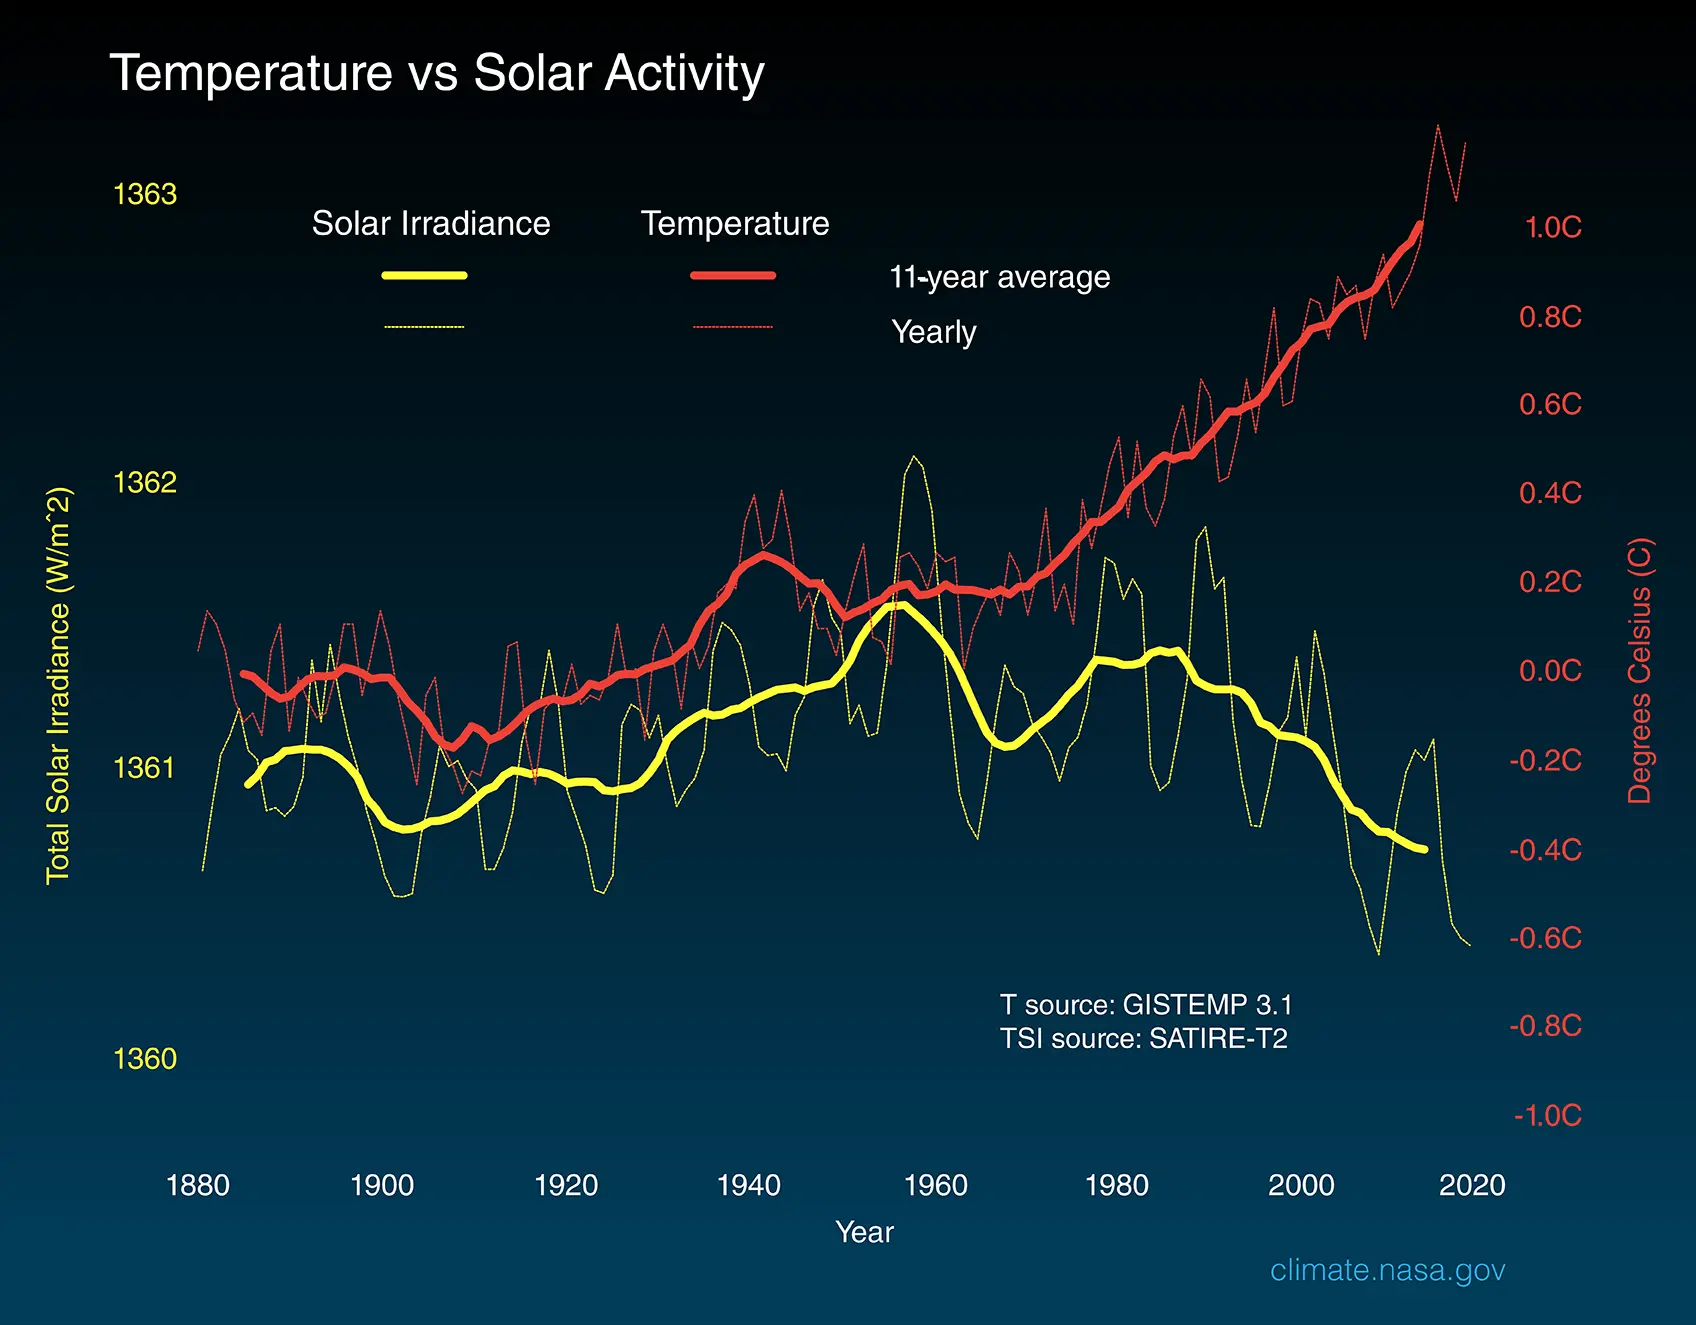
As I have informed you in the past, GIS is one of the most "uppity" global temperature records on the planet, as it massively undercorrects for urban heating effects, land use changes, etc. At the same time, TSI is known to be the
worst index of the sun's effect on global surface temperature, as it does not vary enough to account for the known historical relationship between solar activity and temperature. IOW, your graph is bogus, nothing but a deliberate anti-science fraud, like Lyin' Michael Mann's hockey stick graph.
"The amount of solar energy Earth receives has followed the Sun’s natural 11-year cycle of small ups and downs with no net increase since the 1950s. Over the same period, global temperature has risen markedly. It is therefore extremely unlikely that the Sun has caused the observed global temperature warming trend over the past half-century."
The total
amount of solar energy is known not to vary enough to account for the known historical relationship between solar activity and global surface temperature. That is why anti-CO2 fraudsters reject, without review, all measures of variation in the
type of solar energy the earth receives.
If it's a choice between NASA scientists, and an internet nut...
https://climate.nasa.gov/faq/14/is-the- ... l-warming/
The NASA scientists who are
actually scientists have objected to NASA's anti-CO2 narrative political activist nonscience agenda:
https://www.businessinsider.com/nasa-sc ... nge-2012-4
")

 - By Tainari88
 - By Puffer Fish
 - By wat0n
 - By Fasces