Hindsite wrote:The covid-19 death rates are still going down from that chart. You must be looking at some other chart.
No, they're going up; the figure for the week ending 4th July has already overtaken that for 27th June. But the main point, already made but you need it explained to you again, is that those figures, from death certificates, take time to be recorded. There are still deaths for the week ending 23 May being added to the totals. With the archives, we can construct a table:
Code: Select alldate stats updated Jul 2 Jul 8 Jul 15 Jul 22
wk ending
5/23/2020 6804 6863 6947 7030
5/30/2020 5670 5758 5868 5998
6/06/2020 4306 4443 4646 4843
6/13/2020 3142 3433 3702 4017
6/20/2020 1640 2287 2892 3522
6/27/2020 313 743 1675 3230
7/04/2020 177 643 3276
7/11/2020 272 2531
7/18/2020 690
We can see that, for the week ending 13 June, we've been getting about another 300 deaths reported each following week. W/e 20 June is catching up with that - over 600 new deaths being reporting each week. W/e 27 June had over 900, and then over 1500 new deaths in the last 2 reports. W/e 4 July had over 2600 deaths reported in the last week - it's already overtaken the previous week, and there are probably a lot more to come in, in the future weeks.
The point is that looking at just one report for death certificate causes of death only gives a complete picture for about 3 months back and earlier, because it can take ages for some of the stats to make their way through the system. But what we can see from the trend in weekly reports is that the figures are increasing.


")


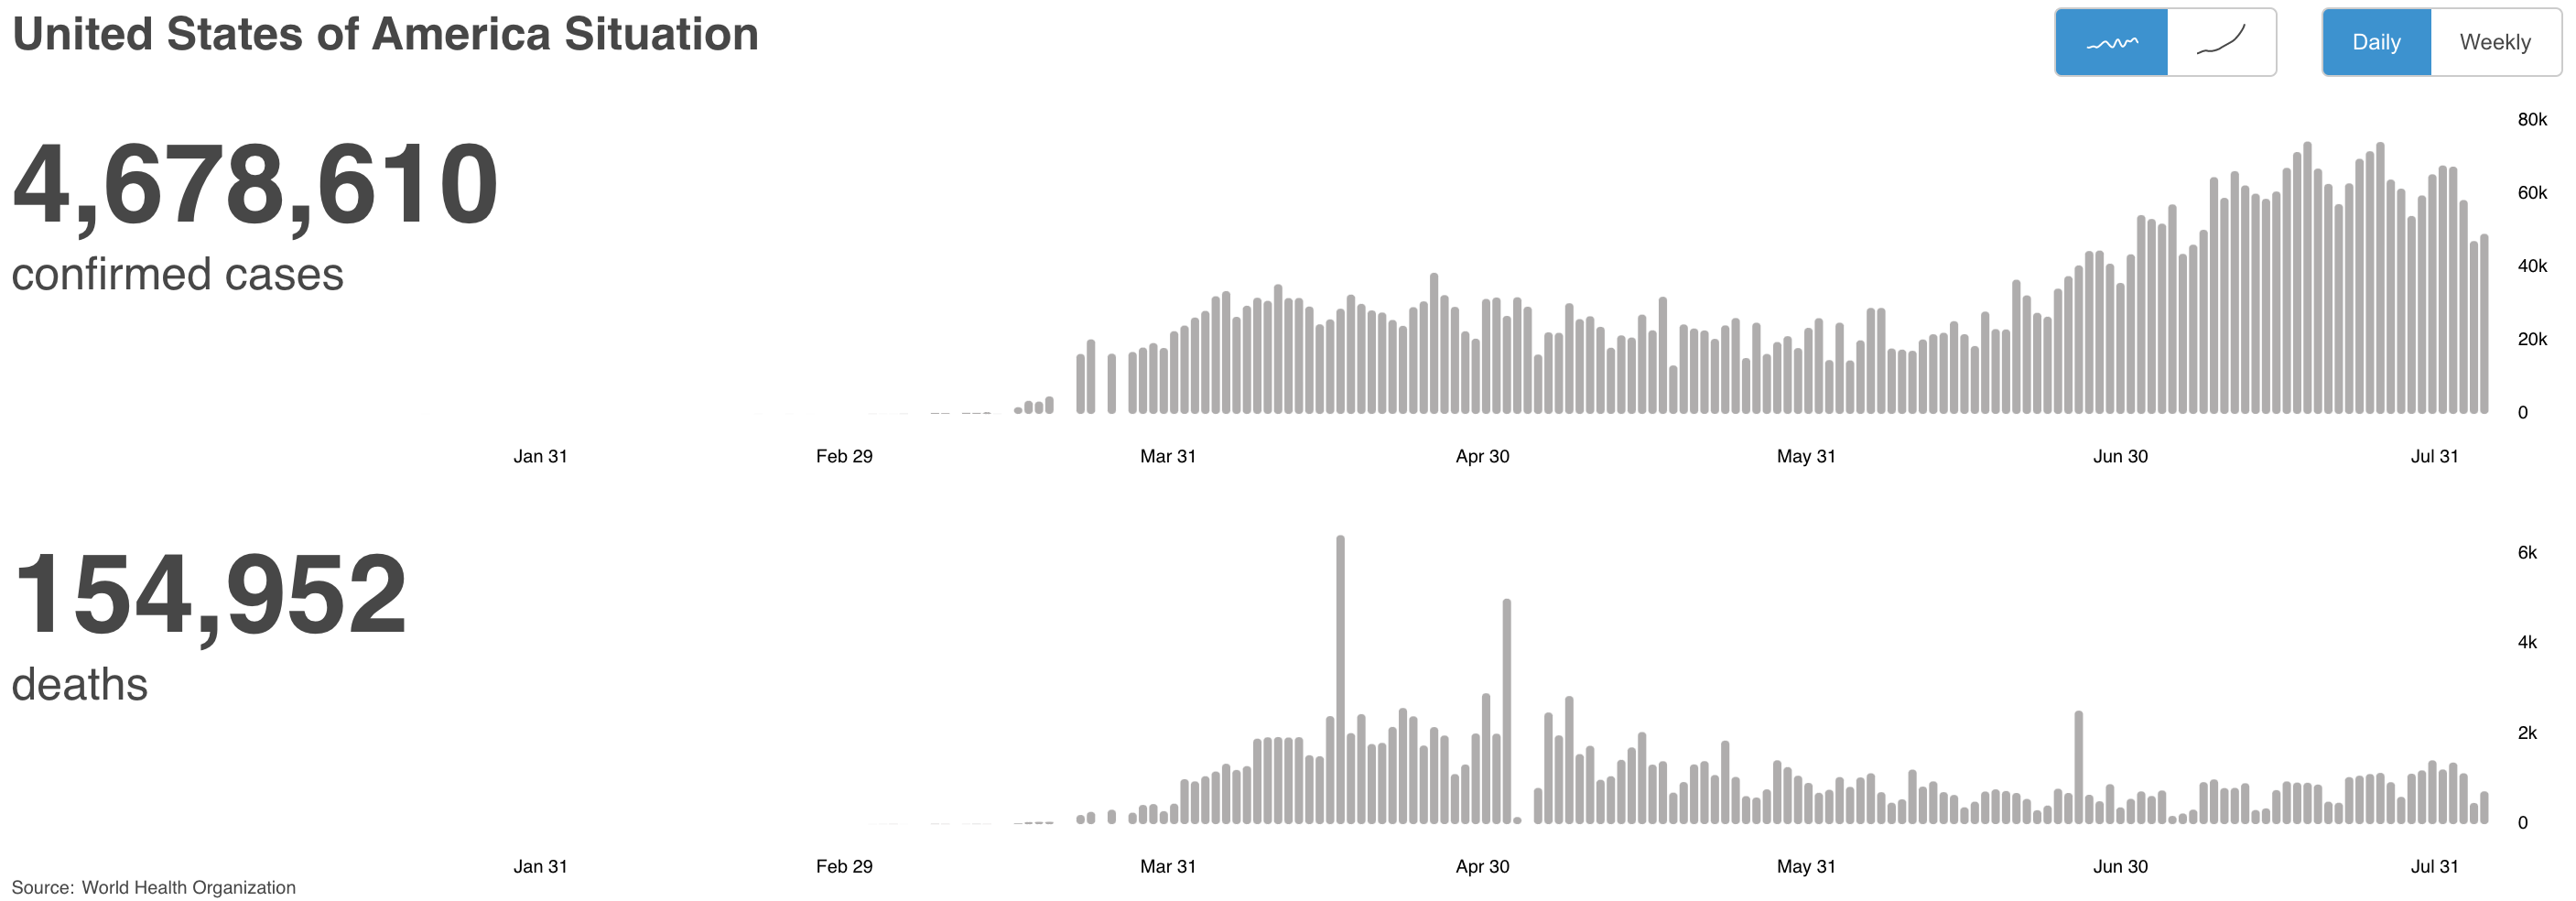


 What part of this downward trend in cases and mostly flat rate of deaths (less than 1/10th of heart disease), for months now, is hard to understand?
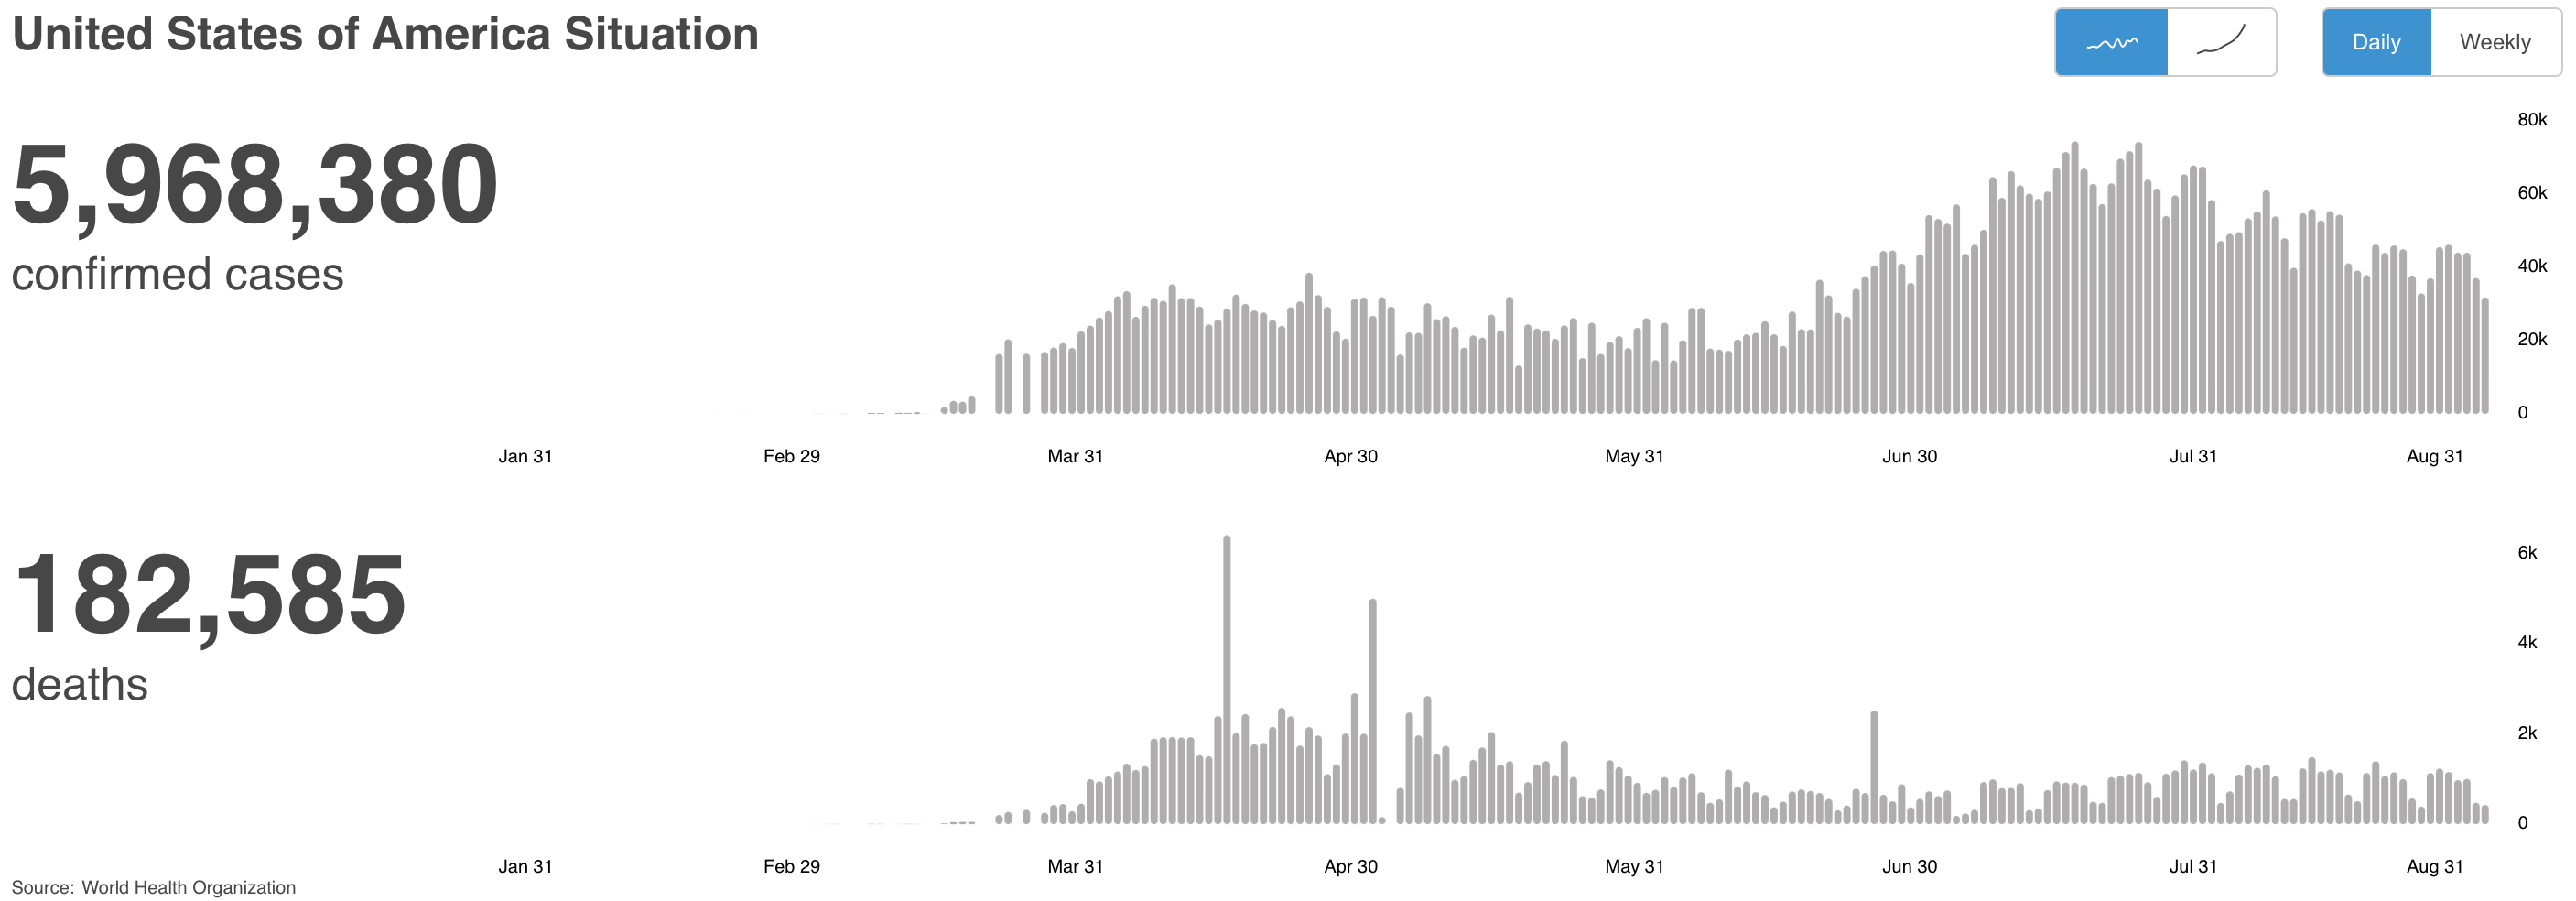
 - By Potemkin
 - By Rich
 - By Puffer Fish