Federal Government Confirms Nearing Apocalypse -- it's very hard to dismiss this. - Page 43 - Politics Forum.org | PoFo

Wandering the information superhighway, he came upon the last refuge of civilization, PoFo, the only forum on the internet ...

Political issues and parties in the USA and Canada.

Moderator: PoFo North America Mods

Forum rules: No one line posts please.
#15058761
Pants-of-dog wrote:@Truth To Power

Why did you try to refute a claim about sea ice volume with a graph about sea ice area?

Volume and area are two different things.
Sorry to be pedantic
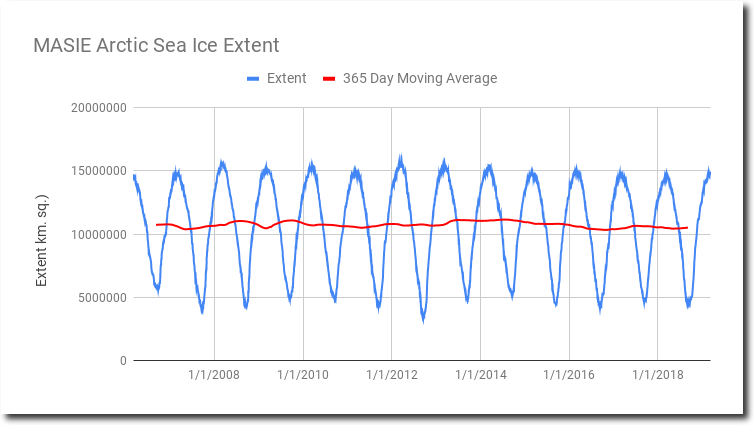
The graph he shared is ice extent.

Extent is calculated using a grid of squares, each square with 15% or more sea ice is included. We could be much more accurate today but then we wouldn't be able to compare like with like historically.

Area is calculated by marking the edge of the ice pack and including the whole area it encloses.

Volume has always been the tougher to calculate. The average ice thickness has become easier as tech has improved but it's also highlighted how much thicker multi year ice has been lost.

The truth is it doesn't matter which you use or which method you use to calculate trend. The result is the same, a trend towards zero. My preference for this was volume simply because we are referring to a three dimensional object and the ice thickness is important when determining how close we are to reaching a BOE.

It's also worth remembering we are talking about reaching a single day of ice below 1m km2 extent and not a magical switch to no ice the whole summer.
#15058798
Shrubs and grasses are springing up around Mount Everest and across the Himalayas, one of the most rapidly heating regions of the planet. Studying images from 1993 to 2018 provided by Nasa’s Landsat satellites, researchers from Exeter University (known socialists, liberals and never trumpers :lol: ) measured the spread of vegetation cover across four height brackets from 4,150 to 6,000 metres above sea level. The study, published in Global Change Biology (Once again, known Commies, never trumpers and all around fake news stooges with a few Iranians tossed in …….. ENEMIES! ENEMIES ALL! :eek: :lol: ), was made possible by Google’s new Earth Engine, which provides researchers with a freely accessible collection of government agency satellite data in the cloud. Previously, researchers would have had to build a super-computer to sift through the enormous quantities of satellite data.
#15058822
Pants-of-dog wrote:Why did you try to refute a claim about sea ice volume with a graph about sea ice area?

I didn't. I showed that data had been dishonestly deleted from Beesknees's graph.
Volume and area are two different things.

Why did the graph Beesknees cited dishonestly delete the data that showed sea ice increasing up to 1979?
#15058827
jimjam wrote:Shrubs and grasses are springing up around Mount Everest and across the Himalayas, one of the most rapidly heating regions of the planet. Studying images from 1993 to 2018 provided by Nasa’s Landsat satellites, researchers from Exeter University (known socialists, liberals and never trumpers :lol: ) measured the spread of vegetation cover across four height brackets from 4,150 to 6,000 metres above sea level. The study, published in Global Change Biology (Once again, known Commies, never trumpers and all around fake news stooges with a few Iranians tossed in …….. ENEMIES! ENEMIES ALL! :eek: :lol: ), was made possible by Google’s new Earth Engine, which provides researchers with a freely accessible collection of government agency satellite data in the cloud. Previously, researchers would have had to build a super-computer to sift through the enormous quantities of satellite data.

Sounds like the left-wing and fake news media giving more aid and comfort to our enemies.
#15058830
Lol!
Good luck getting hold of volume data from satellites prior to the Nimbus 7.
It was the first satellite capable of detecting the difference between old and new sea ice. Which gave us the ability to infer thickness and volume.

https://en.m.wikipedia.org/wiki/Scannin ... radiometer

As for earlier extent
Image
Can anyone see a reason why conspiracy sites would be supplying their acolytes a chart from 1973 ?
#15058833
BeesKnee5 wrote:The truth is it doesn't matter which you use or which method you use to calculate trend. The result is the same, a trend towards zero.

Garbage. The graph I posted proved that is false. There is simply a cycle, and the graph you cited merely cherry-picked the down-phase of the cycle. There is no down-trend:

Image
Why are the empirical data on arctic sea ice before 1979 being systematically censored, deleted, removed, erased and suppressed by anti-CO2 hysteria propagandists?

Image
#15058834
Truth To Power wrote:Garbage. The graph I posted proved that is false. There is simply a cycle, and the graph you cited merely cherry-picked the down-phase of the cycle. There is no down-trend:

[img]https://realclimatescience.com/wp-content/uploads/2019/03/MASIEArcticSeaIceExtent_shadow.png
[/img]
Why are the empirical data on arctic sea ice before 1979 being systematically censored, deleted, removed, erased and suppressed by anti-CO2 hysteria propagandists?

Image
8 days waiting for you to support your claims and still tumbleweed.
#15058837
Truth To Power wrote:I didn't. I showed that data had been dishonestly deleted from Beesknees's graph.


No, you did not.

BeesKnee5’s graph discussed VOLUME of sea ice.

You replied with a graph showing how data was supposedly taken out of a graph on sea ice EXTENT.

Why did the graph Beesknees cited dishonestly delete the data that showed sea ice increasing up to 1979?


You did not show that B5’s graph dishonestly deleted anything.
#15058840
Pants-of-dog wrote:No, you did not.

I most certainly did.
BeesKnee5’s graph discussed VOLUME of sea ice.

So that data on the amount of arctic sea ice before 1979 could dishonestly be suppressed.
You replied with a graph showing how data was supposedly taken out of a graph on sea ice EXTENT.

Graphs on sea ice extent posted by anti-CO2 hysteria propagandists also dishonestly delete pre-1979 data that prove they are lying.
You did not show that B5’s graph dishonestly deleted anything.

Of course I did.
#15058846
BeesKnee5 wrote:Evidence that current sea ice is cyclical
Nothing that is current -- i.e., a snapshot without history -- can be cyclical by definition.

I already posted empirical data showing it decreased in the early 20th century, then increased between the 1940s and the 1970s, despite exponentially rising CO2. Please post your evidence that the cyclical factors that caused that decrease and increase ceased to operate after 1979. Thanks.

I have already provided it. You just despicably dismiss all such evidence as being from "conspiracy sites."
#15058848
Truth To Power wrote:I most certainly did.

So that data on the amount of arctic sea ice before 1979 could dishonestly be suppressed.

Graphs on sea ice extent posted by anti-CO2 hysteria propagandists also dishonestly delete pre-1979 data that prove they are lying.

Of course I did.


Ignoring what I wrote and repeating your incorrect claims is not an argument.
#15058849
BeesKnee5 wrote:Would that be why you chose a non empirical dataset like MAISIE.

Why do you feel you have to make $#!+ up?

"MASIE uses the most recent full day of data from NIC, obtained nightly"

https://nsidc.org/data/masie
Something that's sources varied from day to day and so provides no historical comparisons.

I gave you the historical comparisons, and you dismissed them as being from a "conspiracy site."
#15058852
BeesKnee5 wrote:Evidence that current sea ice is cyclical and will increase in future would do as a start.

The rest of your claims you can provide evidence for later.

sea ice is cyclical

You might wonder how Antarctic sea ice could be increasing while global warming is raising the planet’s average surface temperature. It’s a question scientists are asking, too. One reason may be that other atmospheric changes are softening the influence of global warming on Antarctica. For example, the ozone hole that develops over Antarctica each spring actually intensifies a vortex of winds that circles the South Pole. The stronger this vortex becomes, the more isolated the Antarctic atmosphere becomes from the rest of the planet. In addition, ocean circulation around Antarctica behaves differently than it does in the Arctic. In the Southern Ocean, warm water tends to sink downward in the ocean’s water column, making sea ice melt from warm water less likely.

Because of differences in geography and climate, the amount, location, and natural variability of sea ice in the Arctic and the Antarctic are different. Global warming and natural climate patterns may affect each hemisphere’s sea ice in different ways or at different rates. Within each hemisphere, sea ice can change substantially from day to day, month to month, and even over the course of a few years.

Comparing conditions at only two points in time or examining trends over a short period is not sufficient to understand the impact of long-term climate change on sea ice. Scientists can only understand how sea ice is changing by comparing current conditions to long-term averages.

https://earthobservatory.nasa.gov/features/SeaIce
#15058856
Truth To Power wrote:Why do you feel you have to make $#!+ up?

"MASIE uses the most recent full day of data from NIC, obtained nightly"

https://nsidc.org/data/masie

I gave you the historical comparisons, and you dismissed them as being from a "conspiracy site."
It's not that it isn't maintained, it's what it is maintained from.

This is what the guy who dreampt up MAISIE has to say on it.

'MASIE repackages data from the NIC, and incorporates an ice edge hand drawn by analysts working with whatever satellite data they have available at the time. It is an “operational” product designed to produce a “best effort” ice edge each day, based on whatever data may be available at the time.
Visual data is obviously not available in winter, and the ice edge is often obscured by clouds in summer. Synthetic Aperture Radar can “see in the dark” and through clouds, but suffers from different limitations. The whole of the Arctic isn’t covered every day for example. In addition, and unlike the SII, data from different satellite sensors is incorporated which means there are inevitably inconsistencies from day to day and from year to year. There is also an element of “human subjectivity” because different analysts are working with different sources of data from one day to the next. Since the quantity and quality of data varies the time series will not be consistent over time.
On the other hand the SII was designed to use a consistent methodology over a long period of time using a single type of sensor. 100% automatically processed passive microwave data is the “gold standard” when it comes to determing sea ice trends. It is subject to some biases and thus is not necessarily as accurate on a given day as MASIE. However, the biases are consistent over time, so the time series will be consistent over time. This means that year-to-year comparisons and trend estimates will be more accurate in the passive microwave data than in MASIE.'
  • 1
  • 41
  • 42
  • 43
  • 44
  • 45
  • 50

Yeah, I'm in Maine. I have met Jimjam, but haven'[…]

No, you can't make that call without seeing the ev[…]

The people in the Synagogue, at Charlottesville, […]

@Deutschmania Not if the 70% are American and[…]