Climate change causes and impacts are accelerating, experts warn - Page 2 - Politics Forum.org | PoFo

Wandering the information superhighway, he came upon the last refuge of civilization, PoFo, the only forum on the internet ...

Pollution, global warming, urbanisation etc.
Forum rules: No one line posts please.
#15043895
Truth To Power wrote:30% of WHAT??? You aren't thinking.

You are not paying attention.


Please go back and reread the text quoted from the Solanki studies. It clearly discussed the 30%.

Look at a graph of global temperature over the last 120 years. The ~60-year cycle is VISUALLY OBVIOUS.


Please present the graph. Thanks.
#15043922
BeesKnee5 wrote:I get that again you are creating a theory unsupported by the research you quote whilst at the same time admitting you don't understand what you are seeing.

Without reading further, I know that YOU will now prove that YOU don't understand it. Watch:
What you are describing is the Pacific Decadal Oscillation.
https://climate.ncsu.edu/climate/patterns/pdo
We have measured it, we know it's effects.
Again this cannot be used to attribute warming over the last 50!years.

See? You made the exact same mistake again. Because the PDO cycle is ~60y, OBVIOUSLY the up and down effects over a 50y stretch will largely cancel each other out. But over the 30y stretch the Solanki paper specifically mentioned, there was no down-phase to cancel the up-phase.
As has already been said, there is no evidence to support solar being the key driver of recent warming.

Depends what you mean by "recent." Over 1970-2000, the up-phase of the 60y cycle dominated. But over the last 120y, two complete 60y cycles with no net effect, the sun dominated. I already explained that to you, very clearly and patiently. You just refused to understand it.
PDO overturning every 20-30 years isn't the driver of recent warming although it was a contributor to the strong el niño in 1997/98 that have us an exceptionally warm year.

There is no "recent" warming. Arctic sea ice bottomed out in 2012. Other claimed warming is caused by data tampering and fabrication.
I know it's hard for you to accept, but the change in atmospheric composition is a driver.

But minor compared to solar variation.
Things like sulphur and particulates cool. Methane, CO2 and water vapour warm.

Methane and CO2 have very little effect because their absorption spectra are already almost saturated by water vapor.
These things have positive feedbacks, an increase in CO2 does increase temperature , this increases evaporation and that boosts the effect, which melts ice in Siberia, Canada and Alaska that allows the release of Methane, Nitrous Oxide and more CO2.

The assumed feedbacks are wildly exaggerated, and have not been confirmed empirically. Indeed, Angstrom showed over 100 years ago that CO2 has very little effect on IR absorption.
One factor we are starting to see is the reduction of coal burning and this will reduce the short term cooling effect that it's emissions produce.

It's more complicated than that. Emissions from fossil fuels, especially coal burned inefficiently for home heating, etc., also contain soot, which reduces albedo, warming the planet.
So more warming is already baked in and the transition away from fossil fuels will have a short term additional effect on warming in the lower atmosphere.

Nonsense.
#15043940
Truth To Power wrote:Without reading further, I know that YOU will now prove that YOU don't understand it. Watch:
See? You made the exact same mistake again. Because the PDO cycle is ~60y, OBVIOUSLY the up and down effects over a 50y stretch will largely cancel each other out. But over the 30y stretch the Solanki paper specifically mentioned, there was no down-phase to cancel the up-phase.
Depends what you mean by "recent." Over 1970-2000, the up-phase of the 60y cycle dominated. But over the last 120y, two complete 60y cycles with no net effect, the sun dominated. I already explained that to you, very clearly and patiently. You just refused to understand it.
There is no "recent" warming. Arctic sea ice bottomed out in 2012. Other claimed warming is caused by data tampering and fabrication.

The desperation to believe your interpretation is off the scale. You need your 'cycle' to be cooling for your theory to work and so you have to claim the GAC of 2012 didn't happen and the reduction in August 2012 represents a low tide. You now resort to claiming any warming since is caused by fake information rather than accept you are wrong. It's hilarious that you quote data and cherry pick in this way, picking and choosing which lines of research are true based on your preconception. Solanki isn't supporting your claim he is actively disproving it.

The world isn't playing ball , Arctic sea ice extent today is 723,000 km2 lower than 2012. To put that in context that's a decrease of nearly 15%. Three out of the last four years are lower than 2012 and yet you are still foolish enough to repeat the claim because that's what you have to believe our your theory falls apart.

But minor compared to solar variation.

False
Methane and CO2 have very little effect because their absorption spectra are already almost saturated by water vapor.

False, see below.
The assumed feedbacks are wildly exaggerated, and have not been confirmed empirically. Indeed, Angstrom showed over 100 years ago that CO2 has very little effect on IR absorption.

Again false
Angstroms claim has been subsequently disproved as the absorption band is wider than he measured and becomes wider based on the concentration of CO2, which is also very relevant to your earlier point.

Image
It's more complicated than that. Emissions from fossil fuels, especially coal burned inefficiently for home heating, etc., also contain soot, which reduces albedo, warming the planet.

Modern coal stations produce very little soot and it depends where the soot falls as it remains in the atmosphere for a very short period, if you were talking about soot from forest and peat fires you might have a point.

Nonsense.

Standard response when a fact doesn't fit your narrative.
Last edited by BeesKnee5 on 21 Oct 2019 21:06, edited 1 time in total.
#15043958
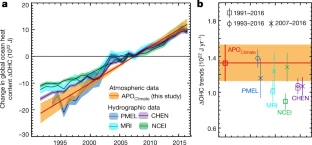
The Nature retracted a study published last year that found oceans were warming at an alarming rate due to climate change. The prestigious scientific journal issued the formal notice for the paper published Oct. 31, 2018, by researchers at the University of California, San Diego's Scripps Institution of Oceanography. Climate science is losing its credibility. Some experts warned that if emissions continue, sea level rise could reach 3 feet by the end of the century, a more than 10% increase from 2013 predictions. It is reasonably suspected that climate data presented by some experts are manipulated to exaggerate the extent of climate change.


RETRACTED ARTICLE

Quantification of ocean heat uptake from changes in atmospheric O2 and CO2 composition

This article was retracted on 25 September 2019

Image

Abstract
The ocean is the main source of thermal inertia in the climate system1. During recent decades, ocean heat uptake has been quantified by using hydrographic temperature measurements and data from the Argo float program, which expanded its coverage after 20072,3. However, these estimates all use the same imperfect ocean dataset and share additional uncertainties resulting from sparse coverage, especially before 20074,5. Here we provide an independent estimate by using measurements of atmospheric oxygen (O2) and carbon dioxide (CO2)—levels of which increase as the ocean warms and releases gases—as a whole-ocean thermometer. We show that the ocean gained 1.33 ± 0.20 × 10²² joules of heat per year between 1991 and 2016, equivalent to a planetary energy imbalance of 0.83 ± 0.11 watts per square metre of Earth’s surface. We also find that the ocean-warming effect that led to the outgassing of O2 and CO2 can be isolated from the direct effects of anthropogenic emissions and CO2 sinks. Our result—which relies on high-precision O2 measurements dating back to 19916—suggests that ocean warming is at the high end of previous estimates, with implications for policy-relevant measurements of the Earth response to climate change, such as climate sensitivity to greenhouse gases7 and the thermal component of sea-level rise8.

Shortly after publication, arising from comments from Nicholas Lewis, we realized that our reported uncertainties were underestimated owing to our treatment of certain systematic errors as random errors. In addition, we became aware of several smaller issues in our analysis of uncertainty. Although correcting these issues did not substantially change the central estimate of ocean warming, it led to a roughly fourfold increase in uncertainties, significantly weakening implications for an upward revision of ocean warming and climate sensitivity. Because of these weaker implications, the Nature editors asked for a Retraction, which we accept. Despite the revised uncertainties, our method remains valid and provides an estimate of ocean warming that is independent of the ocean data underpinning other approaches. The revised paper, with corrected uncertainties, will be submitted to another journal. The Retraction will contain a link to the new publication, if and when it is published.

https://www.nature.com/articles/s41586-018-0651-8
#15043965
Pants-of-dog wrote:Please note that the retraction deals with the level of uncertainty and does not contradict the central claim that the oceans are warming.
The most interesting thing about that story is the majority of the scientific community doubted the level of warming range claimed and were subsequently proven to be right to doubt. Once the mistake in the calculation was identified then it was correctly withdrawn.

It's a good thing that when a fault is found the research is corrected or withdrawn.
#15044140
BeesKnee5 wrote:The desperation to believe your interpretation is off the scale.

I'm not the one desperately trying to whip up hysteria over a global warming "crisis" or "emergency" that people can see for themselves is not happening. You are.
You need your 'cycle' to be cooling for your theory to work and so you have to claim the GAC of 2012 didn't happen and the reduction in August 2012 represents a low tide.

What part of, "It's never been lower in the satellite era than the low of summer 2012," are you having trouble understanding?
You now resort to claiming any warming since is caused by fake information rather than accept you are wrong. It's hilarious that you quote data and cherry pick in this way, picking and choosing which lines of research are true based on your preconception.

As they say in Japan, "It's mirror time!"
Solanki isn't supporting your claim he is actively disproving it.

False, as already proved. He just knew he had to genuflect to the anti-CO2 scare campaign to get his paper published.
The world isn't playing ball

Right: it isn't playing ball with the absurd scaremongering of the anti-CO2 hysteria campaign.
Arctic sea ice extent today is 723,000 km2 lower than 2012.

<yawn> I am old enough to remember when your silly scare campaign said it would all be gone 10 years ago.
To put that in context that's a decrease of nearly 15%.

Oogah boogah!!!
Three out of the last four years are lower than 2012 and yet you are still foolish enough to repeat the claim because that's what you have to believe our your theory falls apart.

The claimed unstoppable down-trend in minimum summer arctic sea ice extent has been decisively broken. It will not return. Take it to the bank.
False. False, see below.

Fact. See below.
Angstroms claim has been subsequently disproved as the absorption band is wider than he measured and becomes wider based on the concentration of CO2, which is also very relevant to your earlier point.

That's just baldly false:

Image

See? YOUR OWN GRAPH PROVES ME RIGHT AND YOU WRONG.

It shows that even increasing CO2 by 300% (so far it is up less than 50% over the pre-industrial level) would have barely any effect, and only on the margins of the absorption spectrum. You just refuse to know the facts YOUR OWN GRAPH identifies.
Modern coal stations produce very little soot and it depends where the soot falls as it remains in the atmosphere for a very short period, if you were talking about soot from forest and peat fires you might have a point.

GARBAGE. Go to Korea, where you can SEE the brown air blowing over from China.
Standard response when a fact doesn't fit your narrative.

Mirror time.
#15044142
Truth To Power wrote:I'm not the one desperately trying to whip up hysteria over a global warming "crisis" or "emergency" that people can see for themselves is not happening. You are.

What part of, "It's never been lower in the satellite era than the low of summer 2012," are you having trouble understanding?

As they say in Japan, "It's mirror time!"

False, as already proved. He just knew he had to genuflect to the anti-CO2 scare campaign to get his paper published.

Right: it isn't playing ball with the absurd scaremongering of the anti-CO2 hysteria campaign.

<yawn> I am old enough to remember when your silly scare campaign said it would all be gone 10 years ago.

Oogah boogah!!!

The claimed unstoppable down-trend in minimum summer arctic sea ice extent has been decisively broken. It will not return. Take it to the bank.

Fact. See below.

That's just baldly false:

Image

See? YOUR OWN GRAPH PROVES ME RIGHT AND YOU WRONG.

It shows that even increasing CO2 by 300% (so far it is up less than 50% over the pre-industrial level) would have barely any effect, and only on the margins of the absorption spectrum. You just refuse to know the facts YOUR OWN GRAPH identifies.

GARBAGE. Go to Korea, where you can SEE the brown air blowing over from China.

Mirror time.


I think we can add an inability to read graphs to your skills.

Have you actually been to Korea?
Here is the current level of air pollution on the Korean/Chinese border. I don't need to visit as I have access to the air quality monitoring stations.
Image

Sea ice now over 800,000 km2 below 2012 and the gap is widening. We are at the point where you are having to deny reality.

I'm not interested in projections by Al Gore, although I understand why the sudden drops in 2007 and 2012 caused concern. That three of the last 4 years have been lower as a yearly average tells us the downward trend continues and no amount of crying by you is changing that.
Last edited by BeesKnee5 on 22 Oct 2019 20:40, edited 3 times in total.
#15044274
Pants-of-dog wrote:I did not.
I see no indication of a repeating 60 year cycle.

"Denial ain't just a river in Africa." -- Mark Twain
BeesKnee5 wrote:I think we can add an inability to read graphs to your skills.

The graph clearly says I am right and you are wrong: even QUADRUPLING atmospheric CO2 will have hardly any effect on total IR absorption, just as Angstrom demonstrated more than a century ago.
Have you actually been to Korea?

Yes.
Here is the current level of air pollution on the Korean/Chinese border. I don't need to visit as I have access to the air quality monitoring stations.
Image

Sorry, wrong again. That only tells you how polluted the air is,not how DARK it is.

GET IT???
Sea ice now over 800,000 km2 below 2012 and the gap is widening.

It's only below the level at THIS DATE in 2012. Nowhere near the record summer low.
We are at the point where you are having to deny reality.

No, you are. The reality is that there is no climate emergency, no crisis, no reason to think added CO2 will be anything but beneficial.
I'm not interested in projections by Al Gore, although I understand why the sudden drops in 2007 and 2012 caused concern.

OK, then let's have YOUR projection: in what year will arctic sea ice disappear entirely in the summer? My prediction is that it will increase over the next 20 years, and won't disappear entirely in our lifetimes despite a continued near-exponential increase in atmospheric CO2.
That three of the last 4 years have been lower as a yearly average tells us the downward trend continues and no amount of crying by you is changing that.

Nope. It indicates the bottoming-out of a cycle, not a continued downtrend.
Last edited by Truth To Power on 23 Oct 2019 20:05, edited 2 times in total.
#15044308
Pants-of-dog wrote:Well, anyone can look at that chart and decide for themselves whether or not this trendless 60 year cycle is apparent.

Right. Anyone, even you, can look at it and see that the blue line goes DOWN for ~30y from 1880-1910, and then UP for ~30y from 1910-1940, then DOWN again (though not as steeply, because of the multi-millennial high in solar activity) for ~30y from 1940-1970, then UP again for ~30y from 1970-2000:

Image
#15044314
Truth To Power wrote:Right. Anyone, even you, can look at it and see that the blue line goes DOWN for ~30y from 1880-1910, and then UP for ~30y from 1910-1940, then DOWN again (though not as steeply, because of the multi-millennial high in solar activity) for ~30y from 1940-1970, then UP again for ~30y from 1970-2000:

Image
Down between 1940-1970. Are you for real?

What offset solar energy and atmospheric warming in that period was the PDO being in a cool phase.

Image

What's happened since 2000?
Low solar cycles, your cycle supposedly falling, PDO largely negative and yet temperatures still rising.

You are a busted flush.
#15044317
Truth To Power wrote:The graph clearly says I am right and you are wrong: even QUADRUPLING atmospheric CO2 will have hardly any effect on total IR absorption, just as Angstrom demonstrated more than a century ago.

The graph shows Angstom got his calculations wrong because he was unaware that the absorption wavelength widens with the density of the gas. This means the rising CO2 levels have a significant impact he was unaware of, even if already saturated in a narrower band.
"Have you actually been to Korea?"
Yes

Then you would know three things,
a. There is no such country
b. Only North Korea borders China and China has no significant coal power stations on the border.
c. China has some of the strongest exhaust pipe emission controls that were introduced in 2014 and have built the newer supercritical power stations. The bulk of their pariculate air pollution is transport and cities
Sorry, wrong again. That only tells you how polluted the air is,not how DARK it is.

GET IT???

Yes, I chose the option of particulate air pollution.
It's only below the level at THIS DATE in 2012. Nowhere near the record summer low.

You are desperate to choose 6 weeks of a year when the Arctic was hit by a huge storm. This is the ultimate in cherry picking.

Let's expand things.
2019 was lower than 2012 in Jan, Feb, Mar, Apr, May Jun, Jul and is now much lower than 2012 in October with the month not yet finished. Sea surface temperatures are currently 2C higher and the gap is now over 900,000 km2.

This matters, multi year ice is gone, if a similar cyclone had hit the pack this year then the low for a few weeks in 2012 would be gone and the reality of the situation is this will happen again at some point in the future. We are no longer looking at a solid multi year mass piled up against the north of Greenland, this year there was the rarity of open water and a small sailing boat was able to make the trip around the north of Greenland.
No, you are. The reality is that there is no climate emergency, no crisis, no reason to think added CO2 will be anything but beneficial.


Yet you have failed to provide one shred of evidence to support this.

We have a feedback loop already happening, the lack of sea ice in the summer is allowing warmer waters to enter the Arctic basin from the Atlantic and the Pacific, the open sea is absorbing heat that ice previously reflected. Each year the freezing season moves a little later and progresses a little slower, this is why this year's ice extent is now much, much lower than 2012.

This image of the Bering straight in winter I posted on another thread shows how the extent is being reduced by the additional warmth in the ocean
Image

I don't know when the Arctic will go ice free in the summer, as 2012 shows that is very much in the hands of the weather during August when the ice pack is thin, but each year the chances increase and I would be surprised if we waited more than 30 years on current trend.

Nope. It indicates the bottoming-out of a cycle, not a continued downtrend.


We are currently 600,000 km2 lower than 2018, that's nearly 10%, and at this point in the season 2018 was 700,000 km2 lower than 2017. What you are showing is a clear denial of the evidence in front of you. There is no guarantee next year will be higher or lower than this but it is highly likely that it will begin with the lowest ice extent in modern records.
Last edited by BeesKnee5 on 23 Oct 2019 22:49, edited 1 time in total.
  • 1
  • 2
  • 3
  • 4
  • 5
  • 8

No. The U of A encampment was there for a day or […]

It’s not even the case that all Zionists are Jews[…]

Weird of you to post this, you always argued that[…]