
- 23 Sep 2021 16:39
#15191862
This is poorly written.
Please write a few simple and clear sentences with a clear argument or refutation. Provide sources for any claims. Once you show that you have the required reading comprehension and writing skills, we can discuss whatever it is you are claiming.
Back to my argument:
https://www.carbonbrief.org/analysis-wh ... -to-humans
The article goes on to show the effect of the major natural forces (solar and volcanic activity) that are causing cooling, and how much larger the anthropogenic warming is.
There is a crack in everything,
That's how the light gets in...
Truth To Power wrote:Of course it is.
That is nothing but absurd, anti-scientific garbage. Why would it?
That is a claim based on objectively false premises.
No, he is objectively correct.
No, he is being completely honest by reporting the fact that 2016 was hotter than 2020.
Right. It is a lie that you made up. Where did I or Spencer say the planet has cooled "remarkably"?
No, that is what you said:
Remember?
Shocker...
But only in one direction? It naturally cools but never warms?
And it is, as I already demonstrated.
No it isn't. I already proved that to you.
If your objectively false premises were true instead of being objectively false.
This is poorly written.
Please write a few simple and clear sentences with a clear argument or refutation. Provide sources for any claims. Once you show that you have the required reading comprehension and writing skills, we can discuss whatever it is you are claiming.
Back to my argument:
https://www.carbonbrief.org/analysis-wh ... -to-humans
- How much warming is caused by humans?
In its 2013 fifth assessment report, the IPCC stated in its summary for policymakers that it is “extremely likely that more than half of the observed increase in global average surface temperature” from 1951 to 2010 was caused by human activity. By “extremely likely”, it meant that there was between a 95% and 100% probability that more than half of modern warming was due to humans.
This somewhat convoluted statement has been often misinterpreted as implying that the human responsibility for modern warming lies somewhere between 50% and 100%. In fact, as NASA’s Dr Gavin Schmidt has pointed out, the IPCC’s implied best guess was that humans were responsible for around 110% of observed warming (ranging from 72% to 146%), with natural factors in isolation leading to a slight cooling over the past 50 years.
Similarly, the recent US fourth national climate assessment found that between 93% to 123% of observed 1951-2010 warming was due to human activities.
These conclusions have led to some confusion as to how more than 100% of observed warming could be attributable to human activity. A human contribution of greater than 100% is possible because natural climate change associated with volcanoes and solar activity would most likely have resulted in a slight cooling over the past 50 years, offsetting some of the warming associated with human activities.
‘Forcings’ that change the climate
Scientists measure the various factors that affect the amount of energy that reaches and remains in the Earth’s climate. They are known as “radiative forcings”.
These forcings include greenhouse gases, which trap outgoing heat, aerosols – both from human activities and volcanic eruptions – that reflect incoming sunlight and influence cloud formation, changes in solar output, changes in the reflectivity of the Earth’s surface associated with land use, and many other factors.
To assess the role of each different forcing in observed temperature changes, Carbon Brief adapted a simple statistical climate model developed by Dr Karsten Haustein and his colleagues at the University of Oxford and University of Leeds. This model finds the relationship between both human and natural climate forcings and temperature that best matches observed temperatures, both globally and over land areas only.
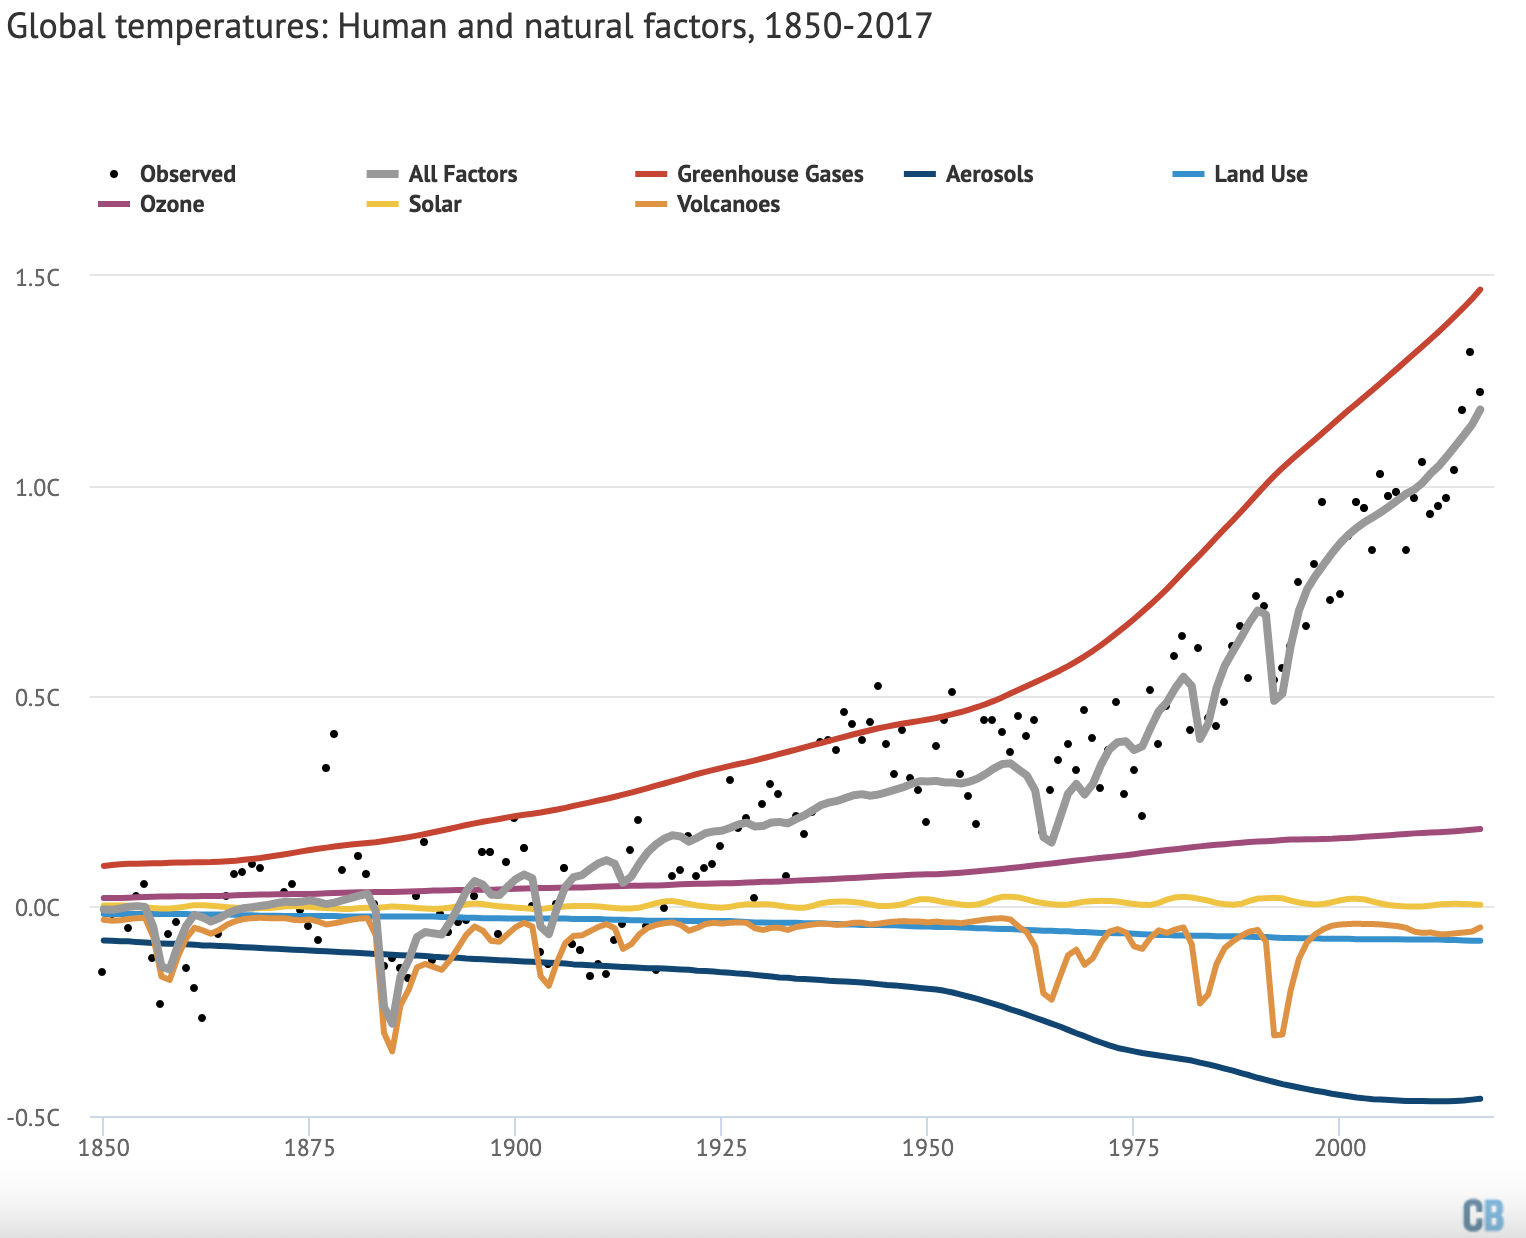
The figure below shows the estimated role of each different climate forcing in changing global surface temperatures since records began in 1850 – including greenhouse gases (red line), aerosols (dark blue), land use (light blue), ozone (pink), solar (yellow) and volcanoes (orange).
The black dots show observed temperatures from the Berkeley Earth surface temperature project, while the grey line shows the estimated warming from the combination of all the different types of forcings.
…..(article continues)…..
The article goes on to show the effect of the major natural forces (solar and volcanic activity) that are causing cooling, and how much larger the anthropogenic warming is.
There is a crack in everything,
That's how the light gets in...
")

 - By skinster
 - By Tainari88
 - By Negotiator
 - By FiveofSwords