
- 31 Jul 2022 03:21
#15241067
You asked me to explain how the sun's magnetic field affects clouds. Invoking the sun's magnetic field would not have been responsive. Although you and the other AGW screamers routinely resort to such disingenuous tactics, it would not occur to me to do so because I am too honest.
No, just honesty -- something you evidently have no way to even recognize when you see it.
It's the best satellite temperature record of the lower troposphere.
Of course that is a bald falsehood.
?? Because that was the year the world stopped warming and started cooling, the year the cooling trend started, the year the cooling is since.
How could that be relevant to whether the most recent trend is cooling?
The sad thing is, you actually imagine all that is relevant.
Garbage. There is also a smoothed version of the same data that shows the same trend:
https://www.drroyspencer.com/wp-content ... 022_v6.jpg
You're not paying attention. UAH data ARE for the whole world. That is the point of using satellite rather than surface temperature data.
No one would dishonestly pretend to think that "cooling since 2016" meant there had been no interval of warming in six years. Would they??
Because the point was the most recent or current trend, not the trend from 2015 to 2016. Hello?
Steve_American wrote:1st, his possible mechanisms [for the sun's magnetic field] to heat or cool the earth don't include the sun's magnetic field.
You asked me to explain how the sun's magnetic field affects clouds. Invoking the sun's magnetic field would not have been responsive. Although you and the other AGW screamers routinely resort to such disingenuous tactics, it would not occur to me to do so because I am too honest.
They are all something else. While those things may be effected by magnetic fields on the sun, the field itself apparently has no effect. So, sloppy word usage.
No, just honesty -- something you evidently have no way to even recognize when you see it.
2nd, I looked at his linked evidence. I don't know how accurate or reliable it is.
It's the best satellite temperature record of the lower troposphere.
However, even using it as good he has distorted it a lot.
Of course that is a bald falsehood.
Mainly, because he chose the year 2016 and not the year 2015.
?? Because that was the year the world stopped warming and started cooling, the year the cooling trend started, the year the cooling is since.
. . . So, from the graph under the world map, I can truthfully say that the world has been warmer and often a lot warmer in every year since 2015.
How could that be relevant to whether the most recent trend is cooling?
. . . Another thing is that the graph has data points for each month. They must be averaged over the whole world. So, in Jan., 2016 it was very hot. This means that the heat in the summer of the southern hemisphere overwhelmed the cold of the winter of the northern hemisphere. In fact that month was a shocking 0.70 deg. C above the average temp of from 1991 to 2020. Compared to Apr. 2015 when the temp was about 0.033 deg. C less than that average temp. This is swing of 0.733 deg. C. Another swing was from Jan. 2016 to Apr., 2016, when the temp fell from 0.7 down to 0.2 deg. C, a drop of 0.5 deg. C in 4 months.
The sad thing is, you actually imagine all that is relevant.
In other words, this data obscures the trends
Garbage. There is also a smoothed version of the same data that shows the same trend:
https://www.drroyspencer.com/wp-content ... 022_v6.jpg
by keeping the wild temp swings as the seasons change (remember averaging the whole world, which might average out the swings, but doesn't).
You're not paying attention. UAH data ARE for the whole world. That is the point of using satellite rather than surface temperature data.
Another point is that there have been 3 humps after Apr. 2015. The 1st started at the low of Apr., 2015 to the peak of Jan 2016, & down to the low point of Sept. 2018; and then a second hump from the low in Sept. 2018 until the next low in Apr. 2021; and then a 3rd from Apr., 2021 to the next low of now (which could go lower still). Note that, the duration of each hump has changed each time. So, because thee were 3 humps in the time frame he chose to talk about, he is wrong to assert that the temp has been *cooling or dropping* since 2016. He implied with those words that to temp has gone down mostly consistently over that time frame, and it has gone up and down 2 or 3 times.
No one would dishonestly pretend to think that "cooling since 2016" meant there had been no interval of warming in six years. Would they??
My final point on this is that his source (which may be wrong) shows a spike in Jan 2016, and he chose to start from there and not from Apr. 2015 or Apr. 2016, when it was much cooler.
Because the point was the most recent or current trend, not the trend from 2015 to 2016. Hello?
")

 - By Fasces
 - By Rich
 - By Unthinking Majority
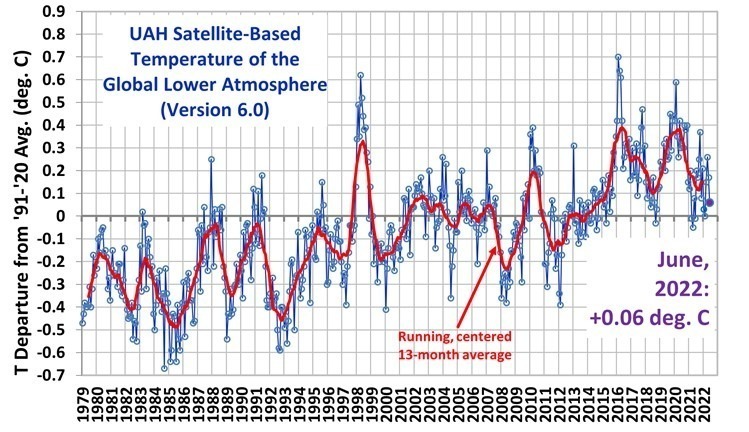