
- 22 May 2021 20:02
#15173674
Here's this weekend's round-up of polls. Anyone that wants to check out any possible links over the next week can go to the link to the left. (Anyone wanting more details on a particular poll, just ask):
- Thirty-eight percent (38%) of Likely U.S. Voters think the country is heading in the right direction, according to a new Rasmussen Reports national telephone and online survey for the week ending May 13, 2021. This week’s finding is down four points from a week ago. Fifty-five percent (55%) of voters believe the nation is headed down the wrong track, up three points from a week ago A year ago at this time, 35% said the United States was heading in the right direction, while 58% said it was on the wrong track.
- Strongly Approve: 31% (-1)
- Strongly Disapprove: 40%
- Total Approve: 51% (+2)
- Total Disapprove: 47% (-2)
- Strongly Approve: 32%
- Strongly Disapprove: 40%
- Total Approve: 50%
- Total Disapprove: 48%
- Strongly Approve: 33%
- Strongly Disapprove: 40%
- Total Approve: 50%
- Total Disapprove: 48%
- Strongly Approve: 27% (-1)
- Strongly Disapprove: 46% (+2)
- Total Approve: 44% (-2)
- Total Disapprove: 56% (+2)
- Strongly Approve: 29% (-1)
- Strongly Disapprove: 43% (+1)
- Total Approve: 46% (-2)
- Total Disapprove: 54% (+2)
- Strongly Approve: 33%
- Strongly Disapprove: 41%
- Total Approve: 49%
- Total Disapprove: 51%
- Strongly Approve: 35%
- Strongly Disapprove: 29% (+1)
- Total Approve: 57%
- Total Disapprove: 42%
- Strongly Approve: 35%
- Strongly Disapprove: 30%
- Total Approve: 56%
- Total Disapprove: 43%
- Strongly Approve: 37% (-1)
- Strongly Disapprove: 28%
- Total Approve: 58%
- Total Disapprove: 41%
The Rasmussen Reports Immigration Index for the week of May 9-13, 2021, rose to 88.1, up from 86.9 two weeks earlier. The index is now as high as it’s been since early February; it reached a record low of 82.3 in late March. The Immigration Index has been under the baseline in every survey since Election Day last year. The index is still more than 15 points below where it was the week of October 22, indicating voters are looking for tighter immigration control from President Joe Biden’s administration.
Fifty-four percent (54%) of Likely U.S. Voters say the chance of a major war in the Middle East is now more likely than it was a year ago. Fourteen percent (14%) believe a major Middle East war is less likely than it was a year ago, and 27% say the chance of war is about the same. A majority of voters (51%) say America’s relationship with Israel is Very Important to U.S. national security. Another 32% say the U.S.-Israel relationship is Somewhat Important to our national security, while nine percent (9%) consider it Not Very Important and four percent (4%) say it’s Not At All Important. Forty-seven percent (47%) of voters say the Biden administration’s policy toward Israel is worse than the Trump administration’s Israel policy, while 25% believe the Biden administration’s Israel policy is better. Seventeen percent (17%) of voters say Biden’s policy toward Israel is about the same as Trump’s policy, and 11% are not sure.
Sixteen percent (16%) of Likely U.S. Voters who say CNN is their favorite cable news outlet and 20% of those who say MSNBC is their favorite correctly estimated the U.S. national debt (currently more than $28 trillion) as being between $20 trillion and $30 trillion. By contrast, 35% of Fox News viewers, and 32% who say they get their news from talk radio, correctly estimated the size of the U.S. national debt. Viewers of CNN and MSNBC are more likely to dramatically underestimate the size of the national debt, as are voters who get their news from major broadcast networks (NBC, ABC and CBS). There were similar effects on questions about health insurance and income tax rates, with viewers of liberal media more likely to get the facts wrong than voters who don’t watch TV news at all. Overall, 28% of Likely Voters correctly estimated the U.S. national debt as being between $20 trillion and $30 trillion. Sixteen percent (16%) overestimated the national debt as more than $30 trillion, while a majority (56%) underestimated the national debt as less than $20 trillion. Among cable news viewers, voters who said CNN is their favorite were most likely (29%) to dramatically underestimate the national debt as being less than $5 trillion. Twenty-five percent (25%) of MSNBC viewers made the same mistake, as did 19% of voters who say Fox News is their favorite and 18% of those who watch “another” cable network and 19% of those who don’t watch cable news. Among broadcast news viewers, 32% of voters who say CBS is their favorite dramatically underestimate the U.S. national debt as being less than $5 trillion, as do 27% of NBC viewers and 26% of ABC viewers. By contrast, the national debt is underestimated as less than $5 trillion by only 14% of voters who say they don’t watch broadcast network news, and 19% of those who say they get their news primarily from talk radio.
Eighty-five percent (85%) of American Adults are at least Somewhat Concerned about the safety of the nation’s computer infrastructure from cyberattack, including 59% who are Very Concerned. Only 11% are Not Very Concerned or Not At All Concerned. Those numbers are just slightly changed from four years ago, when 90% were at least Somewhat Concerned about cyberattacks, with 51% Very Concerned. Only 19% now believe America’s computer infrastructure can ever be made completely safe from cyberattack. Nearly half (48%) say that level of safety is not possible. About one-third (33%) are not sure. In May 2017, 68% believed it was impossible to make U.S. computer infrastructure totally safe from cyberattack. This is comparable to attitudes about avoiding mass shooting incidents. Following two mass shootings in Atlanta, Georgia, and Boulder, Colorado, in March, only 23% of Likely Voters believed such incidents can be completely prevented.
Fifty-nine percent (59%) of American Adults believe it is at least Somewhat Likely that most jobs in America will be done by robots or computers 25 years from now, including 21% who say it’s Very Likely. Twenty-six percent (26%) think it’s Not Very Likely most jobs will be done by robots and six percent (6%) say it’s Not At All Likely. The percentage who believe it’s at least Somewhat Likely most jobs in America will be done by robots or computers within 25 years has decreased slightly from 64% in June 2018. While most Americans believe robots could do most work in the future, they think their own jobs are safe from the robot takeover. Only 13% say their job could be done by a robot, while 72% say a robot couldn’t do their job, but 16% are not sure. Those numbers have changed only slightly since June 2018, when 75% believed their job couldn’t be done by a robot.
Sixty-four percent (64%) of American Adults approve the CDC’s decision that people fully vaccinated against COVID-19 don't need to wear masks or social distance anymore, including 29% who Strongly Approve. Twenty-seven percent (27%) disapprove of the new CDC guidance, including 10% who Strongly Disapprove. Republicans (53%) are much more likely than Democrats (24%) or those not affiliated with either major party (32%) to say they Strongly Approve of the CDC’s decision to end the mask mandate for those fully vaccinated against COVID-19. But while Republicans are more likely to approve of the CDC’s recommendation to end mask mandates for those already vaccinated, Democrats are actually more likely to say they’ve gotten the COVID-19 vaccine. Fifty-eight percent (58%) of American Adults say they have received a COVID-19 vaccination – a number basically unchanged since late April. Seventy-one percent (71%) of Democrats now say they’ve been vaccinated against COVID-19, compared to 51% of Republicans and 52% of the unaffiliated.
Fifty-two percent (52%) of Conservative Likely U.S. Voters who regularly watch TV news most often watch Fox News. Seventeen percent (17%) of conservative news viewers watch Newsmax most often and nine percent (9%) say they watch OAN most often. Twenty percent (20%) of conservative TV news viewers prefer “some other network.” After the controversy over the 2020 presidential election results, some supporters of former President Trump were angered by how Fox News covered the story, and Nielsen ratings indicated a surge of viewers for Newsmax. Thirty-eight percent (38%) of conservative TV news viewers say they’ve changed their favorite network in the past year, while 52% say their preference hasn’t changed. Among those who most often watch Newsmax, 63% say their favorite network has changed in the past year, and 53% of the OAN audience have also changed their favorite network in the past year.
Fifty-five percent (55%) of Likely U.S. Voters prefer a smaller government with fewer services and lower taxes. Thirty-seven percent (37%) disagree and prefer a more active government with more services and higher taxes. Support for smaller government has risen slightly since last November, when 52% of voters said they preferred a smaller government with fewer services and lower taxes. Support for smaller government has ranged from 52% to 70% in regular surveying since 2006. More than two-thirds of voters (68%) say government does not spend taxpayer money wisely and carefully. Only 18% believe government does spend taxpayer money wisely and carefully. Fourteen percent (14%) are not sure.
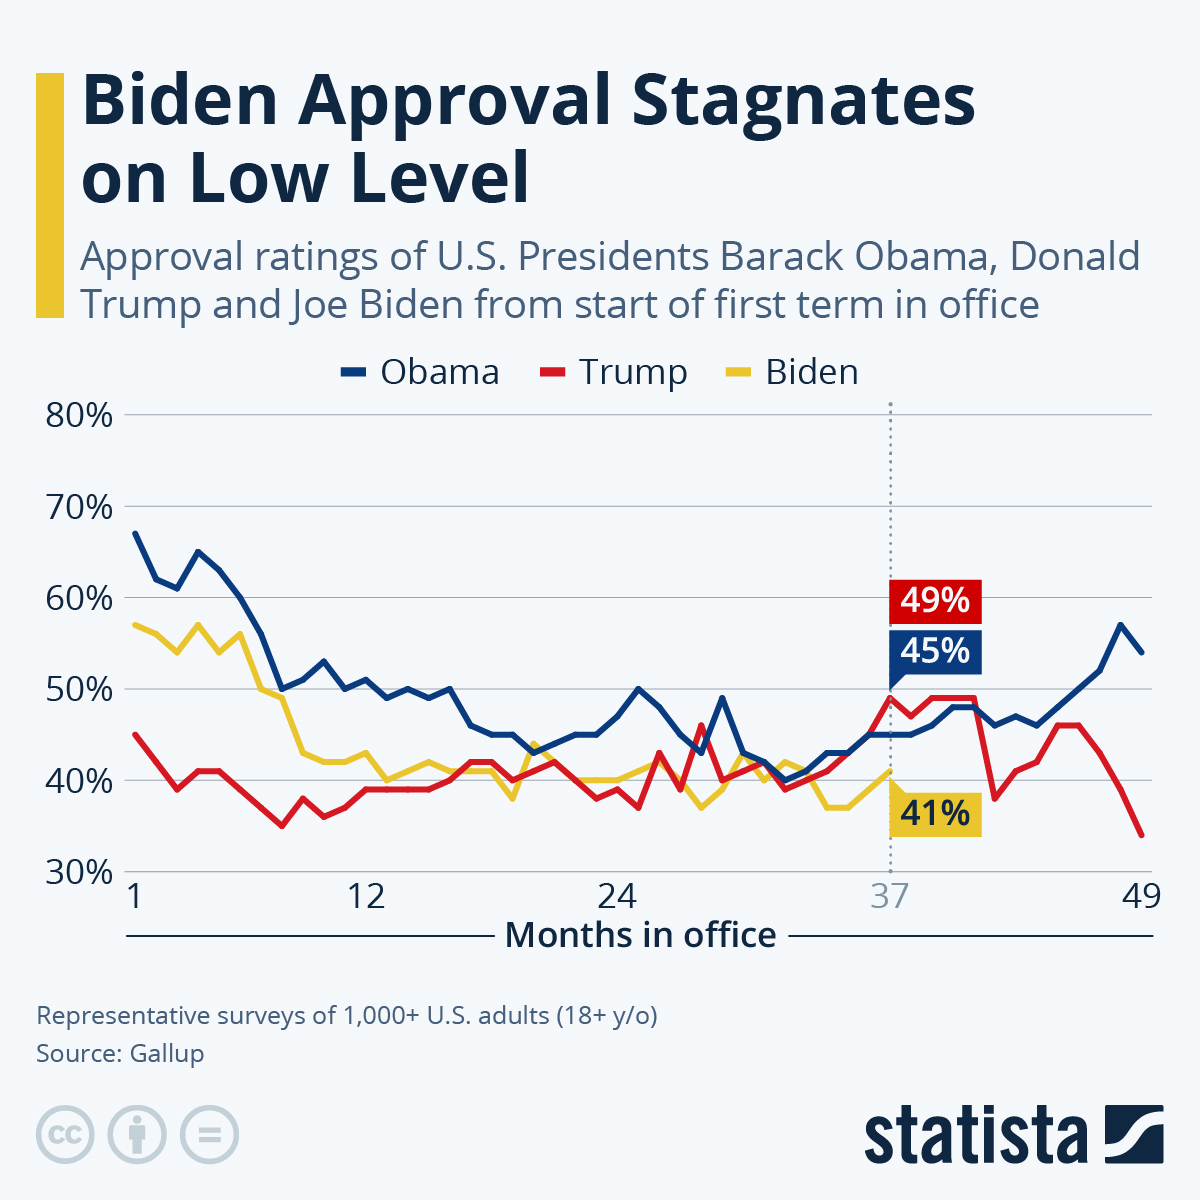
And Biden's job approval picks up slightly again--though again only on the weekly number, the monthly and term to date numbers not even twitching. Interestingly, his Strong Approve number moved in the opposite direction as his Total Approve, that doesn't usually happen:
Over the past month:
And since he took office:
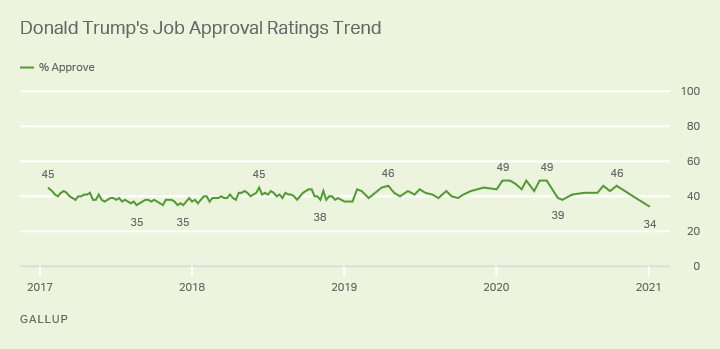
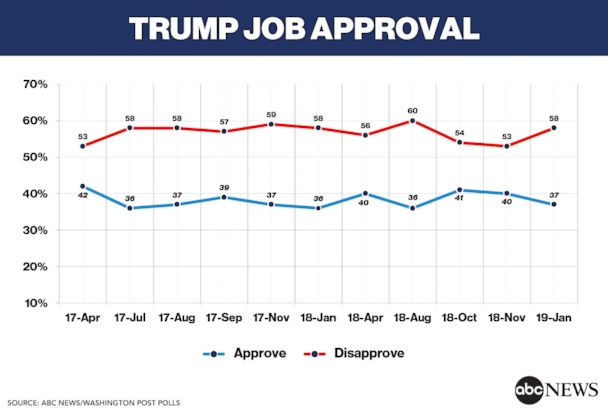
For Trump, this week:
The past month:
And since he took office:
And for Obama this week:
Over the past month:
And since his election:
Society cannot exist, unless a controlling power upon will and appetite be placed somewhere; and the less of it there is within, the more there must be without.
—Edmund Burke
—Edmund Burke
")


 - By SpecialOlympian
 - By Potemkin
 - By Puffer Fish